R Commander brief, Part 3: Basic stats
R Commander in brief
Running basic statistics
In my previous R Commander posts I showed: 1) how to get R Commander working, either from the cloud or on your desktop by using R Studio and 2) how to load your data and some R packages. If you followed those 2 steps you are now ready to start analyzing data. For this post I am using R, as opposed to R Studio.
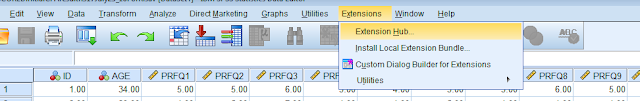
Again, here is the R Commander main window:

Basic descriptive statistics
Below you can see I have already loaded some data and I am proceeding with a basic look at some descriptive statistics...numerical summaries. I am also slowly navigating around the menu bar to show a few of the options available. (video captured with Opentest Chrome extension and converted to gif with Cloudconvert Chrome extension). You can run your frequencies, descriptives, and generate a table of correlations from the dropdown menu I use below, under the Summaries option.

Here I create a histogram showing the distribution of age between men and women. The output opens within my R console.

Regression analyses and models
I won't chat much about modeling here, but to get started you need to set up your model. Under the Statistics menu you select Fit Models. I will show the basics here, but you can see several options in the menu. Once you have run the initial model, you can see the basic regression outputs and you can now use the Models menu options to look at, and use, a variety of powerful options like subsets analysis, bootstrapping confidence intervals, and diagnosing assumptions, outliers, and so on.

So there you have some brief examples of navigating R Commander to generate some outputs. Again, if you are new to R, this is a great way to learn R. You can see the Markdown file and the code and so on.
Enjoy.
Comments
Post a Comment
Please comment if this helpful or if something went wrong. I take requests, so let me know if there is anything you would like me to demonstrate.