All subsets regression using in SPSS
All subsets regression in SPSS
Danger proceed with caution. Variable selection in regression and other forms of modelling is an interesting topic I will discuss another day. Numerous warnings have been written around step-wise regression, and other automated forms of regression (e.g., Thompson, 2006). The problem is that these methods capitalize on chance and variable selection can be rather arbitrary. All subsets regression will also tend to capitalize on chance. I don't want to discuss this in too much detail right now, but at a later date I will jot down some notes including describing suppression effects. When you look at the results below, you can probably see some of this in action.
What is all-subsets regression?
Basically we try to find the 'best' combination of variables based on all of the variables in our data to predict some outcome, our dependent variable. Here I am using linear regression. Best can mean maximizing R-square (variance explained), for example, or other indicators of model fit. For now, it is important to proceed with caution if you chose this approach.In the old days, I would test all-subsets by running all combinations of the independent variables and examining the model R-square and Mallow's Cp and so on (see Kleinbaum et al., 2008) for a description of interpreting model fit and identifying the best subset). Of course, the number of possible subsets is n^2 -1. SO, in the example below, 7 predictors gives 127 different models from which to choose! Thus, the number of subsets grows exponentially as you add predictor variables. Automated processing is therefore rather useful.
Here I am using the Regression Best Subsets extension available in SPSS.
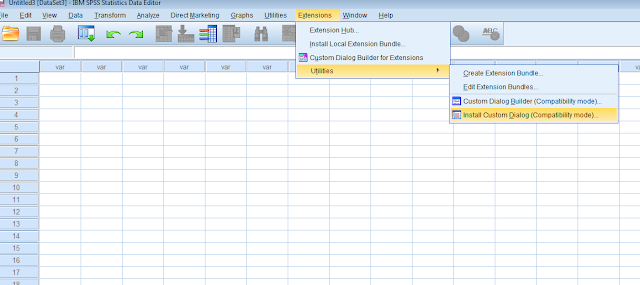
To use this extension you will need to install it first. You can do this by going to the Extension Menu and select the Extension Hub:

The Extension Hub opens up and you can search for subsets. It looks like this in the Hub:

This extension will run without the R or Python plug-ins. So, you can go ahead and install this by ticking the Get Extension box and clicking OK. (There are many cool extensions here, check them out)
Running the subsets analysis
Once installed, you can find the routine under the Analyze menu as seen here:

Selecting this option opens a simple window with space for an dependent variable and a set of independent variables.

Note, the variables should be named with no more than 8 characters, with no strange symbols. I had to change "PSOC.Sat" to "PSOCSat", because it did not like the dot.
Output
If you click OK, the output looks like this. First is a big table with all of the subsets arranged by AIC (Akaike Information Criterion). As you can see we have all of the key indicators of model fit, e.g., AIC, Mallow's Cp, Adj R-square and so on.

Below the table you also have a graph showing the difference between Mallow's Cp and the number of parameters in the model/subset:
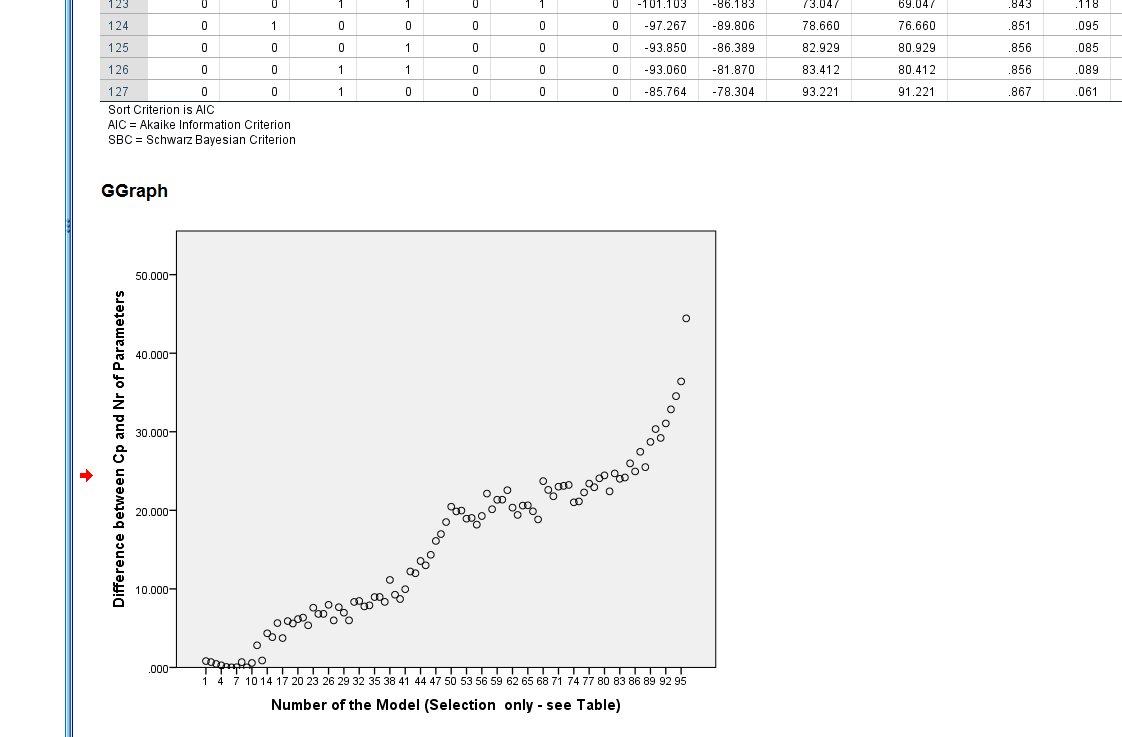
The graph shows the difference between the Cp and number of parameters in the model the model number. You can consult the table to see the details. You can also open the graph to edit the look and output, as you normally would in SPSS.
For interpreting these outputs, I recommend one of my favorite books by Kleinbaum et al. (2008).
I quite like the output in SPSS, it is simple and informative. I will show how to do this in R/RStudio if I can get around to it. But the SPSS routine and output seem more useful to me.
Cheers!
References
Kleinbaum, D. G., Kupper, Nizam, M., & Muller (2008). Applied Regression Analysis and Other Multivariable Methods, 4e. Brooks/Cole.
Thompson, B. (2006). Foundations of Behavioral Statistics: An Insight-based Approach. Guilford Press.
ReplyDeleteReally a Awesome article for understanding the regression models, But some few regressions are left out. Beta regression, probit regression, tobit regression, multinomial logistical regression and probably a few others. Overall the article was so good you nailed it. Thanks for sharig one of the greatest and Informative article.
Visit Us For More: http://www.statswork.com/services/data-mining/multiple-regression-analysis/