Basic Statistics in Google Sheets: Part 1
Basic Statistics in Google Sheets: Part 1
The new Statistics add-on in Google Sheets is a powerful and handy little tool.In this post I show how to add the option to Sheets and I show how to generate basic descriptive statistics.
'Installing'
To use the add-on you need to add it by selecting the Add-ons option. As you can see I have it 'installed' already below, but I will show you where to find it. Installation is quick and easy since this occurs in the cloud.

After you select Get add-ons (as in above picture), search for Statistics:

You will then select the following to install as an add-on.

I have it added already. You will see this button:
 instead of the Manage button above.
When you press it, it will update the add-ons in Sheets so you will have a Statistics option.
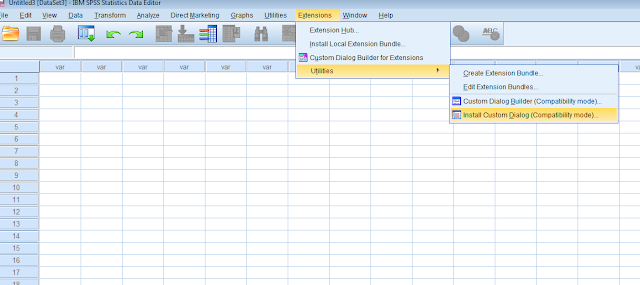
Now once again you select Add-ons from the menu bar, as in the first screen shot at the start of this post.
Under the Statistics option you can see Describe data and Regression options. The help option will eventually lead you to the manual here: https://sites.google.com/site/statisticsforspreadsheets/
The manual is quite good, but I will note some basics here anyway.
Descriptive statistics
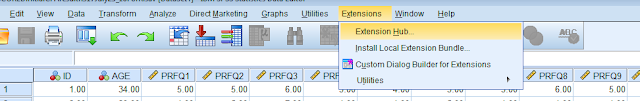
Below you can see how to select variables for inclusion into the descriptives option. Here I look at some continuous variables, but you can also examine categorical data:

I have some sample outputs below. The outputs appear in the tabs at the bottom. In the gif above you can see 3 output tabs, e.g., "Univariate 3" You actually get some handy figures like density functions, box plots and qq plots. There are handy for screening your data and identifying outliers. As you can see below, the figures and somewhat interactive in terms of identifying specific points.
Histograms

Box-plot and qq plot

As seen above you can click the figure and hover over each point. It is quick and responsive. Figures are also customizable with the edit option, as seen above with the pen hovering outside of the highlighted qq-plot.
In part 2 I will examine the surprising powerful Regression options in Sheets Statistics.
Comments
Post a Comment
Please comment if this helpful or if something went wrong. I take requests, so let me know if there is anything you would like me to demonstrate.