Free Statistical Software: SOFA Part 2
Free Statistical Software: SOFA Part 2
In part 1 I briefly introduced SOFA by showing the main page and how to load a file. Here I will show a few basic processes like running an ANOVA and generating a figure (bar graph). I am using rollApp once again, because I am on my Chromebook.
From the home page I selected Statistics, which will open the following window:
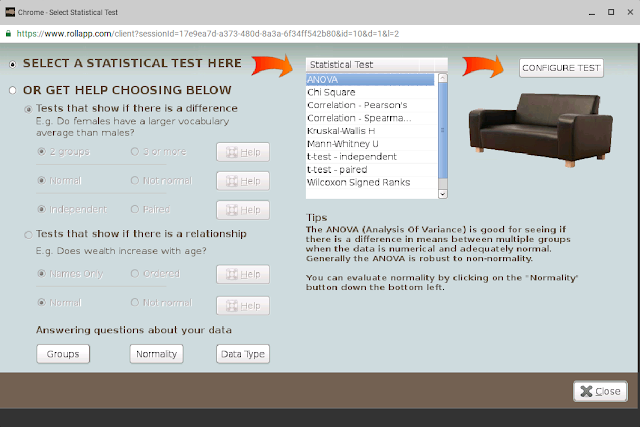
From the above window you have the option of selecting the test you want or you can get suggested tests based upon your needs....i.e., to test a difference or a relationship. You can also look at your data in different ways by selecting one of the buttons at the bottom. For example, I selected Normality:
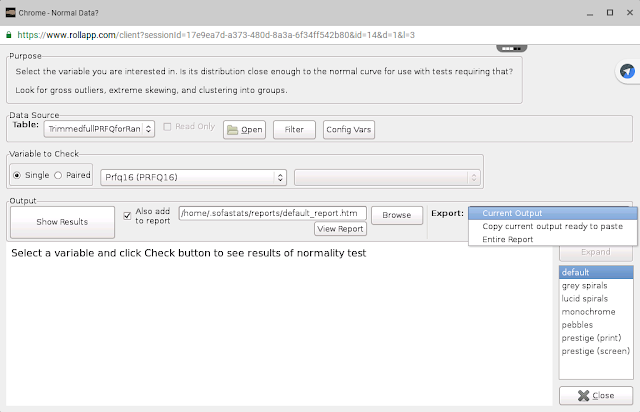
My data was preloaded from my last session (see Part 1) when I opened SOFA from rollApp. I select a variable and tick the box to "Also add to report" which appends the analysis to an existing .htm file. You have other export options as well including exporting to the clipboard. These .htm and clipboard options are a very useful feature. Once you select Show Results the results are displayed in the window. But if you then select View Report, you can view the .htm file in a new window. See below. This .htm file includes other analyses too.
The .htm output looks like this:
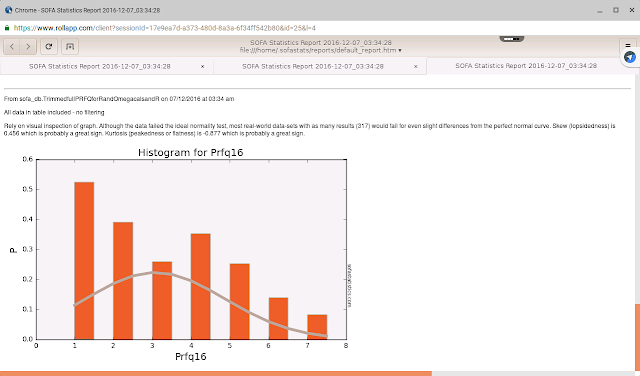
As you can see SOFA has some editorializing about the results providing some advice on how to interpret the results. This is a handy feature for newbies.
Next I select Configure Test from the main statistics window and run an ANOVA:
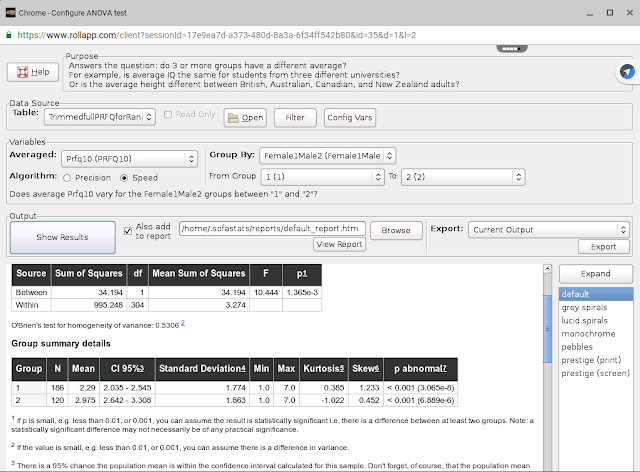
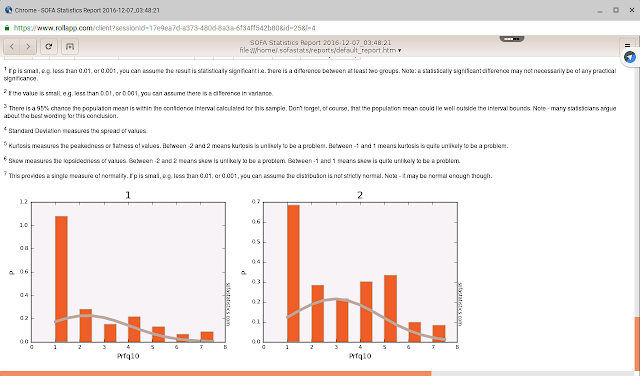
The Group By drop down box selects the independent variable and you identify the range of values. The results are shown in the window above and as you can see I selected the option of adding to the .htm report. You'll note the results include commentary on interpretation. The results include a test of homegeneity and even a test of normality. As you can see below in the .htm screen capture histograms are generated:
Finally, I selected the Charts option from the SOFA main page. The window below opens.
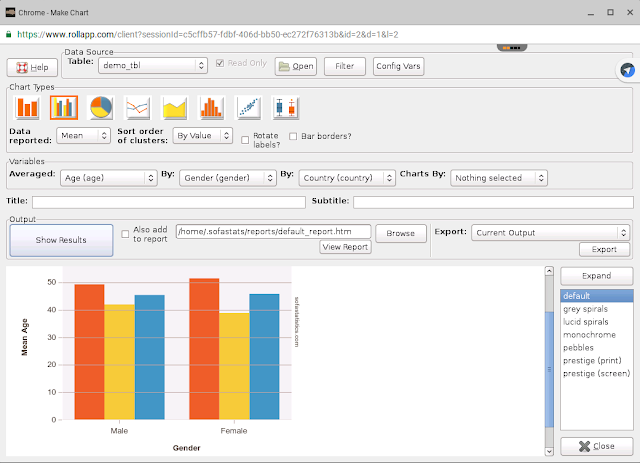
There are some nice options for generating charts. Above I have generated a figure showing gender differences in age by county based upon the sample dataset that comes with SOFA.
As you can see SOFA has some interesting options in terms of displaying and analyzing data. There is also a Report Tables option from the main SOFA window. The interface is similar to the charts and statistics windows, so you can play around with Tables if you like.
In sum
SOFA Statistics is a nice free program with an interesting interface. Advantages include ease of use and the ability to generate output into .htm files and to the clipoard. This makes generating basic reports quick and easy. The types of analyses available are fairly basic but easy to use, making this ideal for those new to statistics. This ease of use coupled with the annotated outputs, which include commentary on interpreting the outputs, make this a handy tool for students or for those new to applied statistics....and it's free....and you can use it from the cloud on rollApp.

Comments
Post a Comment
Please comment if this helpful or if something went wrong. I take requests, so let me know if there is anything you would like me to demonstrate.