Examining Structural or Measurement Invariance (or equivalence) in R and RStudio
Notes on structural/measurement invariance in R (RStudio).
Gross oversimplifications to follow...
A test of measurement or structural invariance (or equivalence) can help one determine if one's measure performs roughly the same across groups. For example, does my measure operate in the same way with men and women. So, if I test the factor structure of a measure does it differ between men and women (or between other groups)? Are the items loading in roughly the same manner? Are the paths and covariates the same? In other words, can I use this particular instrument with more than one group and be confident of my results, say if I compare group 1 to 2? For more depth and accuracy, see Byrne (2013, 2016) or Vandenburg and Lance (2000).
AMOS offers a quick and easy way to conduct a confirmatory factor analysis (CFA). The point and click interface of AMOS is easy to use and learn. AMOS is especially handy when one is interested in tweaking the model by adding and removing variances and covariances, but testing for measurement invariance can be tricky. Therefore, when I want to easily look at structural invariance I turn to R.
R offers a few ways to conduct a CFA. Here I simply load the semTools package and take it from there.
I am using RStudio through the rollApp once again. It seems so much easier to blog on my Chromebook than on my clunky work computer. And thanks to the rollApp support team for letting me know how to copy to my computer's clipboard from an open rollApp app. I will post a summary of the R Code at the very bottom of this post.
Let's get started. Open RStudio and ....
First I install the semTools package:

Second, I enable semTools. Click the semTools box in the 'Packages' window...bottom right.

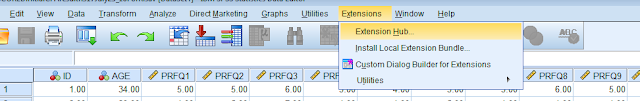
Third, I get my datafile loaded. Select 'Import Dataset' and select 'From local File...' (see image above). Then you can add your file from your Google Drive, or wherever.

My file is saved as a .csv file. RStudio will import it like this below. Select Heading 'Yes' if you have a first row heading in your spreadsheet. The newer version of RStudio does not seem to be on rollApp. The new version seems to import more automatically...but the import is fine.

Fourth, the R package has been installed and loaded, and the data is ready.
Now we can run our CFA. I already have a model I tested in AMOS. So, now I will rewrite my final model in R to test the structural invariance of my measure between men and women.
I have pasted the final model and analysis code into RStudio. We have 3 factors with a number of items on each factor and we have added a covariance between 2 error terms:
 |
| Code for running CFA |
If we run the code in the top panel this generates some results. I don't want to report them all here. But you can see a snapshot:

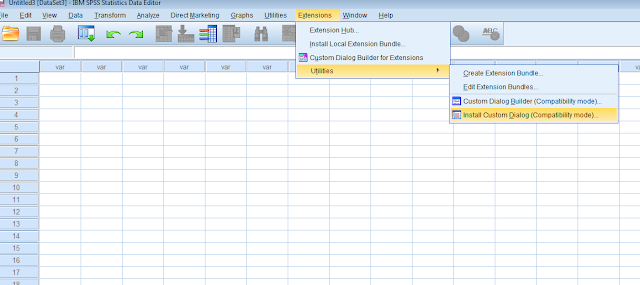
Last, I will run the comparison of factor structures between men and women with the 'measurementInvariance' command. See the screenshot below for how this command is used. The command line appears in the top and bottom left consoles:

The output looks like this:
--------------------------------------------------------------------
--------------------------------------------------------------------
Measurement invariance models:
Model 1 : fit.configural
Model 2 : fit.loadings
Model 3 : fit.intercepts
Model 4 : fit.residuals
Model 5 : fit.means
Chi Square Difference Test
Df AIC BIC Chisq Chisq diff Df diff Pr(>Chisq)
fit.configural 200 16248 16635 438.48
fit.loadings 213 16230 16569 446.96 8.4804 13 0.8109609
fit.intercepts 226 16216 16506 458.83 11.8696 13 0.5383647
fit.residuals 242 16204 16435 479.05 20.2133 16 0.2107653
fit.means 245 16218 16438 499.29 20.2398 3 0.0001514 ***
---
Signif. codes: 0 ‘***’ 0.001 ‘**’ 0.01 ‘*’ 0.05 ‘.’ 0.1 ‘ ’ 1
Fit measures:
cfi rmsea cfi.delta rmsea.delta
fit.configural 0.907 0.088 NA NA
fit.loadings 0.909 0.085 0.002 0.004
fit.intercepts 0.909 0.082 0.000 0.003
fit.residuals 0.908 0.080 0.002 0.002
fit.means 0.901 0.082 0.007 0.002
There you go. The results are compact and contain all of the information your need to proceed. Sadly, interpretation of the results and follow-up steps would take too much room here ;) If you have questions, please leave a comment below.
-shawn
References
Byrne, B. M. (2013). Structural equation modeling with AMOS: Basic concepts, applications, and programming. Routledge.
Vandenberg, R. J., & Lance, C. E. (2000). A Review and Synthesis of the Measurement Invariance Literature: Suggestions, Practices, and Recommendations for Organizational Research. Organizational Research Methods, 3(1), 4–70. https://doi.org/10.1177/109442810031002
R code for running the CFA and the Measurement Invariance analysis is below. You can replace my item and subscale names with your own.:
> PRFQCFA.model <- ' PM =~ PRFQ1 + PRFQ4 + PRFQ7 + PRFQ10 + PRFQ13 + PRFQ16
+ CMS =~ PRFQ15 + PRFQ12 + PRFQ9 + PRFQ6 + PRFQ3
+ IC =~ PRFQ17 + PRFQ14 + PRFQ8 + PRFQ5 + PRFQ2
+ PRFQ6~~PRFQ9'
> fit <- cfa(PRFQCFA.model, data = TrimmedfullPRFQforRandOmegacalsandR)
> summary(fit, fit.measures = TRUE)
> measurementInvariance(PRFQCFA.model, data = TrimmedfullPRFQforRandOmegacalsandR,
+ group = "Female1Male2", strict = TRUE)
Comments
Post a Comment
Please comment if this helpful or if something went wrong. I take requests, so let me know if there is anything you would like me to demonstrate.