Basic Statistics in Google Sheets: Part 2, regression
Basic Statistics in Google Sheets: Part 2, regression
Ordinary Least Squares (OLS) Regression is a powerful general analytic technique based upon the general linear model (GLM). It subsumes analyses like ANOVA, for example.
Well, Google Sheets has a newish add-on for performing basic statistics including some very useful OLS regression options.
To use the Stats add-on in Sheets, you can see my previous post. The current post is dedicated to showing a few of the highlights from the Regression portion of the Statistics add-on.
Note, you can do OLS regression or Logistic Regression, but I am showing OLS regression.
Below I point and click through the basic analytic steps. Note, Sheets will use transformations of the dependent and independent variables as you add them to the model. Also, you can use categorical (factors) variables too.
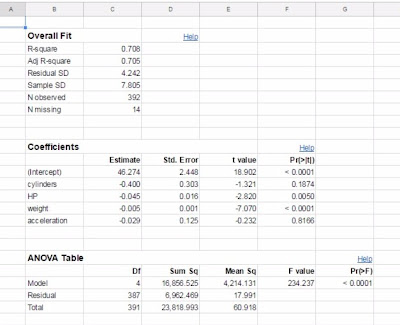
Below I have screen captures of some of the outputs. The basic outputs include the "Overall Fit" as well as regression coefficients and an ANOVA table.
Below we have some figures to help with regression diagnostics. I particularly like the "Influence Plot" If you hover over the figure (in Sheets, not here), it tells you the values for the points. As you can see, Cook's distance and Leverage values cut-off points are identified in the figure too (noted as vertical and horizontal lines)! How handy is that!? (answer is "very").

As you see the Sheet's Statistics add-on is actually quite handy and easy to use with several deep options noted above. If you have an excel file you can open it in Sheets and quickly run diagnostic models or your full regression analysis. Try out the logistic regression option too.
Any questions, give me a shout.


Comments
Post a Comment
Please comment if this helpful or if something went wrong. I take requests, so let me know if there is anything you would like me to demonstrate.