Jamovi: open source free GUI stats software
Jamovi: open source free GUI stats software
What a time to learn stats! When I recieved my formal math and stats training n the 90's we used paper, pencils, and erasers. I was overjoyed to have a calculator that could run simple regression. You could enter pairs of variables: (x1, y1; x2, y2; x3, y3,..). It was great!... the calculator would give you sums of squares and squared sums and so on.
Then grad school comes along and I was introduced to SPSS. My mind was blown, but I didn't quite trust the software. I was always double checking results the old fashioned way.
Fast forward to today, free programs abound and they continue to improve in terms of power and usability. Early free programs include the open source SPSS clone, PSPP (see my brief intro on using PSPP from the cloud here). R, of course, is open source and free but not for the faint of heart.
Jamovi has been introduced recently and it promises to compete with SPSS. Given that Jamovi is built on R and that it is open sourced, I believe the developers when they say it will compete with SPSS. With a cloud computing option this may become unstoppable (Think Chromebook!). Let's see how it measures up in its initial release.
First off, the interface is new and sleek and reminds me vaguely of a Shiny app.
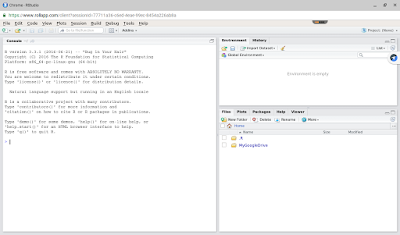
Here is the home screen when you first open the program.

As you can see there are some limited analysis options, but all of the basics are there. You can also see that the data entry is available immediately upon opening the program.
Let's load some data. Here I load some data from my Google Drive, in the form of an Excel spread sheet. I also navigate through the analysis options, just showing what is currently available:
Data loads easily, and as you can see you can adjust the size of the data view and navigate easily. I have not tried opening other file formats yet.

I did install both and it was lightning quick. It just installs without any apparent background work. It is basically instant.
Base R and TOSTER now appear as options in the graphical menu, as you will see below when I run a quick analysis.
As you see above the analysis updates LIVE! Amazing. You can swap variables in and out and see live updates. Also, note how you select the outputs on the right and it shows the original input/analysis setup and you can update it in a sort of live way.
The last thing I will show here is the syntax mode view using R code. This is a mind blowing real time view of how R code works....see below:
Note how the R code is shown in Markdown format. You can see the code updated as I click output options, and then the outputs also update! It is amazing! Great way to learn R and to play with data and output options and update analyses!
I can't tell you how much I am looking forward to following the progress of jamovi. This is truly exciting.
Back to playing with jamovi....and making marking some papers! If you are enjoying jamovi, please let me know!
Quick view
First off, the interface is new and sleek and reminds me vaguely of a Shiny app.Here is the home screen when you first open the program.

As you can see there are some limited analysis options, but all of the basics are there. You can also see that the data entry is available immediately upon opening the program.
Let's load some data. Here I load some data from my Google Drive, in the form of an Excel spread sheet. I also navigate through the analysis options, just showing what is currently available:
Data loads easily, and as you can see you can adjust the size of the data view and navigate easily. I have not tried opening other file formats yet.
Add on Modules
In the top right you can see an option for 'modules'. This is where jamovi will grow and become powerful as folks add various analysis options. When you click the plus sign you can visit the 'jamovi store'...this window below pops up:
I did install both and it was lightning quick. It just installs without any apparent background work. It is basically instant.
Base R and TOSTER now appear as options in the graphical menu, as you will see below when I run a quick analysis.
Navigating analyses
Here is a simple analysis showing some reliability outputs. I love that Omega is included (see my most popular post which happens to be about Omega reliability here). Anyway, this video shows a few things i will explain below. (using Loom, instead of Youtube, it seems to embed better)As you see above the analysis updates LIVE! Amazing. You can swap variables in and out and see live updates. Also, note how you select the outputs on the right and it shows the original input/analysis setup and you can update it in a sort of live way.
Potential for Learning R.
The last thing I will show here is the syntax mode view using R code. This is a mind blowing real time view of how R code works....see below:Note how the R code is shown in Markdown format. You can see the code updated as I click output options, and then the outputs also update! It is amazing! Great way to learn R and to play with data and output options and update analyses!
I can't tell you how much I am looking forward to following the progress of jamovi. This is truly exciting.
Back to playing with jamovi....and making marking some papers! If you are enjoying jamovi, please let me know!
Comments
Post a Comment
Please comment if this helpful or if something went wrong. I take requests, so let me know if there is anything you would like me to demonstrate.