Free statistics software: Using SOFA Statistics Part 1
Using SOFA Statistics: Part 1.
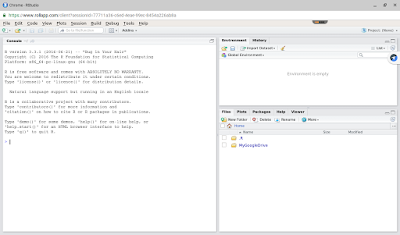
This blog is supposed to be about obscure statistical issues like suppressor effects, ordinal Omega internal consistency reliability, or approaches to inter-rater reliability (as examples), but I can't resist trying new stats software (#procrastimarking?). I found this free statistical software package while using rollApp. I know I am always using rollApp, but it's just so easy to use on my Chromebook and it makes it possible to easily use programs like SOFA and RStudio on the fly.
Anyway, this post shows a brief intro to using SOFA Statistics ...which means Statistics Open For All. This is an interesting little program with some neat features which I will highlight below and in another post (or two). SOFA has more depth than I originally thought and I think it would be rather useful for those new to applied statistics, which is different from the sort of thing I learned from my pure math and stats courses.
Part 1 shows the interface and how to load files. It is fairly easy to use, but here you go anyway ;)
The opening screen is below. You can select among several options including starting a new datafile or importing files. Selecting these options opens new windows. This main window stays open the whole time.

You can open existing datafiles including those in the cloud. As you can see existing datafiles populate the "Data tables" drop down menu. This window opens after selecting Enter/Edit Data.

Or use the Import Data option

 |
| As you can see it opens standard csv, txt and excel files |

The program will automatically import and check the file for formatting.

Here is one example importing an xls file....

And another example importing a csv file.

I'd recommend importing clean .cvs files with little or no missing data. After you select ok, the file is added to the list of file and you can open it (select Open...see below). Here you see the file in the drop down menu.

And the editable file looks like this:

You are now ready to go back to the main page and select Report Tables, Charts, or Statistics.
In the next post I look at the tables, charts, and statistics interface. Please have a look at this software if you need to use something on the fly or if a student needs to quickly generate some tables, charts or results. I will demonstrate some interesting feature in the next post (this one is getting too long and I have to finish marking).
Comments
Post a Comment
Please comment if this helpful or if something went wrong. I take requests, so let me know if there is anything you would like me to demonstrate.